


.jpg) Niels Buksik
Niels Buksik
2 min read
Market Insight November 8, 2021
The Markets Feeling bullish…Investor bullishness ticked higher last week on all four investor sentiment gauges tracked by Barron’s. Investor optimism...
%20(300%20%C3%97%20175%20px)-2.png)
When is a barometer not a barometer?
It’s widely recognized that people do not make perfect financial decisions. In fact, many investors rely on mental shortcuts when asked to make complex decisions. That may be why there are theories that correlate stock market performance to football, hemlines, and sales of headache remedies.
For example, last week several articles about the U.S. stock market used the adage, “As goes January, so goes the year.” The saying describes the January Barometer, which holds that the performance of the Standard & Poor’s 500 Index in January has predictive value. If stocks gain in January, then the Index may gain over the full year. If stocks decline in January, then the Index may suffer losses over the full year.
According to Jeffrey Hirsch and Christopher Mistal of the Stock Trader’s Almanac, the January Barometer has been 84.5 percent accurate since 1950. Of course, the January Barometer was invented in 1972, and when you evaluate its performance since then:
“The January Barometer, in fact, fails real-time tests at the 95 percent confidence level that statisticians often use when determining whether a pattern is genuine. Since 1972 its track record is indistinguishable from a random pattern,” wrote Mark Hulbert in MarketWatch.
You don’t have to look far to find flaws in the pattern.
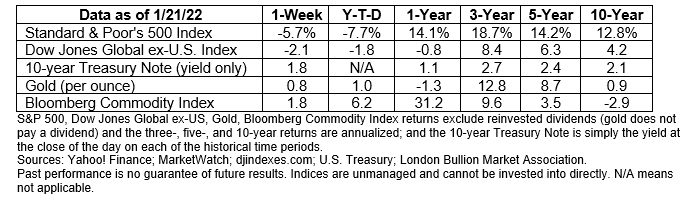
In 2021, the Standard & Poor’s (S&P) 500 Index fell during the month of January and gained 26.8 percent over the full year. The same thing happened in 2020. The S&P 500 declined in January and finished the year with a gain of more than 16 percent. Perhaps this phenomenon will one day be known as the “Pandemic Exception.”
The real takeaway from the past two years isn’t that the January Barometer is flawed, it’s that the U.S. economy, companies, and financial markets have proven to be quite resilient.
Last week, major U.S. stock indices moved lower on uncertainty about inflation, the pandemic, and Federal Reserve policy, reported Mark DeCambre of MarketWatch. The Dow Jones Industrial Average declined 4.6 percent. The S&P 500 was down 5.7 percent, and the Nasdaq Composite dropped 7.6 percent, reported Ben Levisohn of Barron’s.
The silver lining of the pandemic may be found in innovation, which has flourished as companies, economies, and countries have adapted to difficult circumstances.
The Global Innovation Index (GII) tracks 80 indicators that inform innovation. The indicators are grouped into seven categories:
“If you have urgent current expenses to cover, then future priorities like college and retirement fall off your radar because they are simply less pressing. Scarcity of attention prevents us from seeing what's really important. The psychology of scarcity engrosses us in only our present needs.”
—Sendhil Mullainathan, University of Chicago professor and author
Best regards,
Niels Buksik
P.S. Please feel free to forward this commentary to family, friends, or colleagues. If you would like us to add them to the list, please reply to this email with their email address and we will ask for their permission to be added.

2 min read
The Markets Feeling bullish…Investor bullishness ticked higher last week on all four investor sentiment gauges tracked by Barron’s. Investor optimism...
"The pace of the recovery looks like it has slowed… On balance, it looks like the data is pointing to a slowing in the pace of the recovery." The...
Obviously, there’s been nothing normal about living through a pandemic but before we all get back to being epidemiologists the rest of the year,...